Popular Price Analytics: How do I use this module?
Popular Price Analytics aims to empower Agent Partners with updated insights on popular sales and rent prices in the market
Table of contents
What Is Popular Price Analytics?
In addition to Transaction Insights Lite, we have introduced Popular Price Analytics which aims to empower Agent Partners with updated insights on popular sales and rent prices in the market so you can:
- Increase Price Efficiency by establishing competitive sale and rent price through most in demand price trends from leading marketplace analysis.
- Identify Trends by anticipating project performance and trajectory through most in demand price from leading marketplace listing analysis.
- Provide Effective Guidance by recommending competitive listing price through popular sale price distribution within leading marketplace listings.
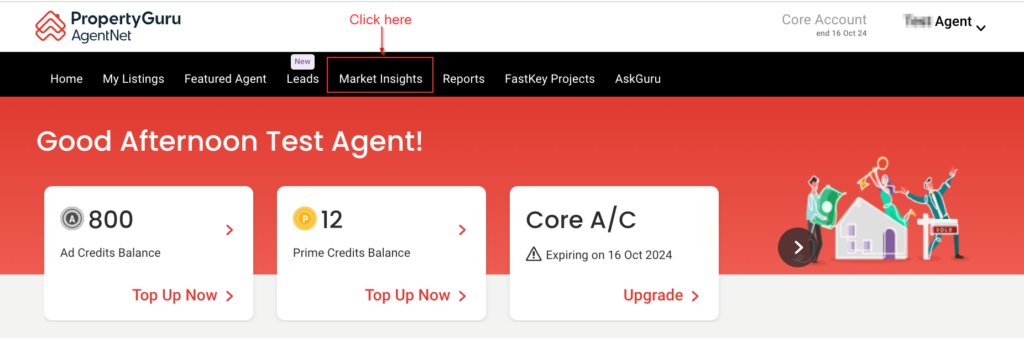
1. Login to AgentNet and click on the Market Insights tab. A new tab will open to land you on our propertyguruforbusiness (pg4business) platform.
First-time Login
If this is your first-time logging onto the pg4business platform, you will be required to confirm your account first. You will not need to log in again after that. The system will log you in automatically.
If this is your first-time logging onto the pg4business platform, you will be required to confirm your account first. You will not need to log in again after that. The system will log you in automatically.
 2. Once logged in to the pg4business platform tab, you can access Popular Price Analytics under the 'Unit Research' category.
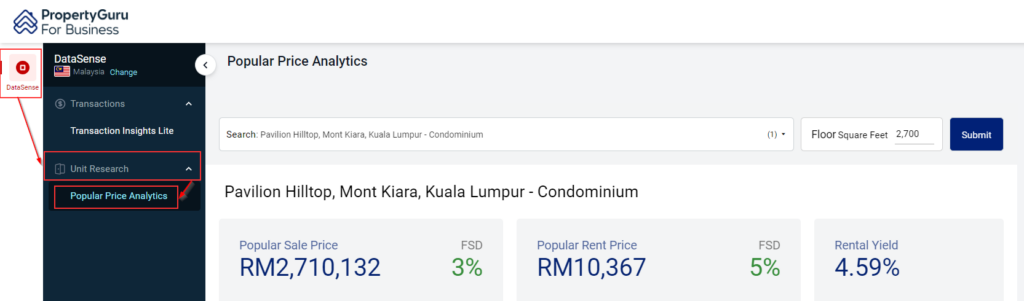 3. To begin a search, type in/select a Project/Township from the first field. Next, key in the Unit Size you want to search in the second field.
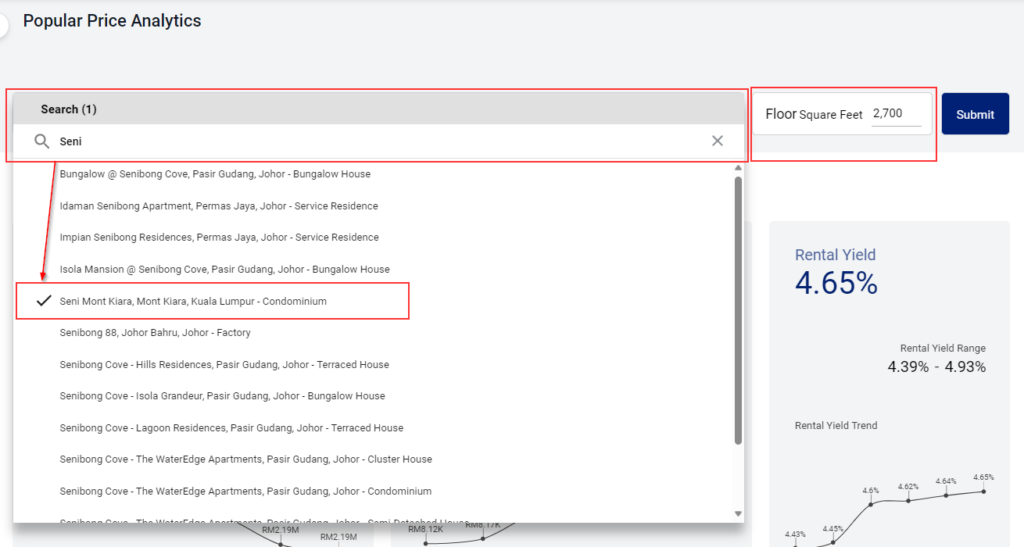 4. Once done, the search will return 3 results:
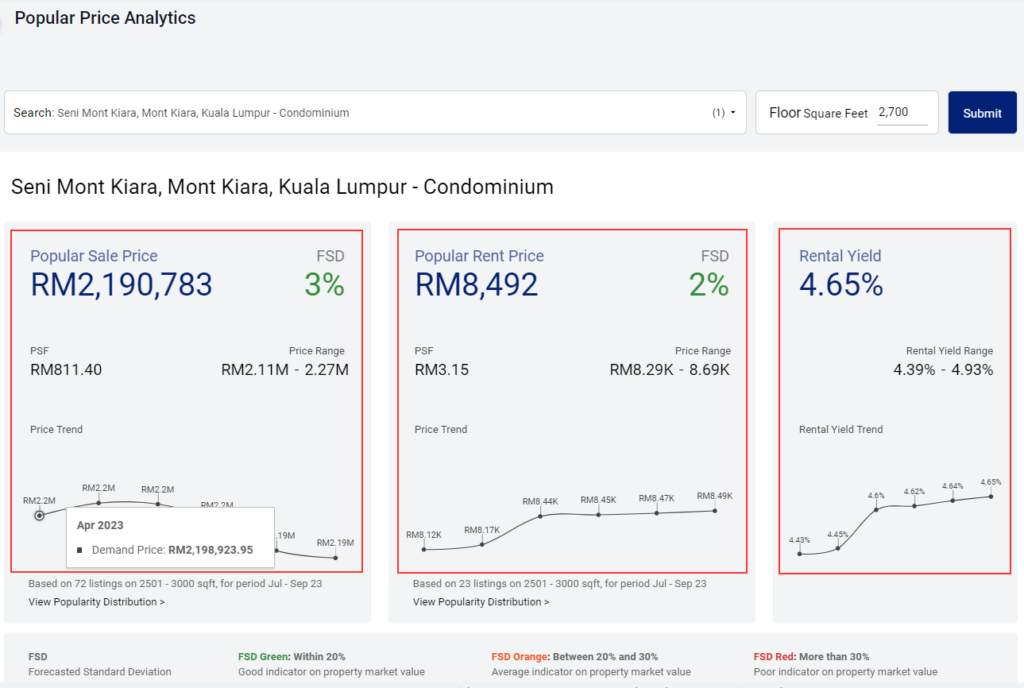
- Popular Sale Price, price PSF, price range, FSD*, and price trend from past 6 months.
- Popular Rent Price, price PSF, price range, FSD*, and price trend from past 6 months
- Rental Yield**, rental yield range, and rental yield trend from past 6 months
** Rental Yield = [ (Popular Rent Price X 12) / Popular Sale Price ] x 100%
Note 2: Any of the above boxes may display "No Data" if there is no available information for that demand aspect for that respective property.
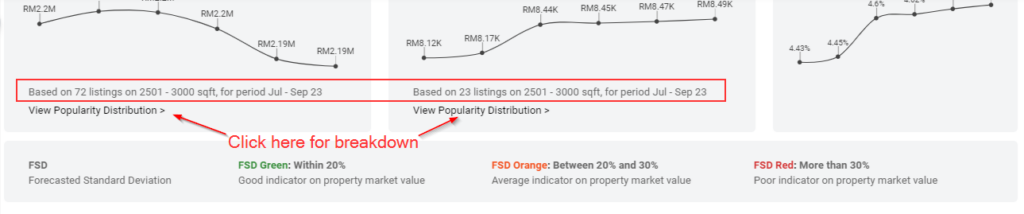
5. Below Popular Sale Price and Popular Rent Price trends, is a description on the nature of the data (number of listings, area sqft & available period) of which the respective insights are derived from.
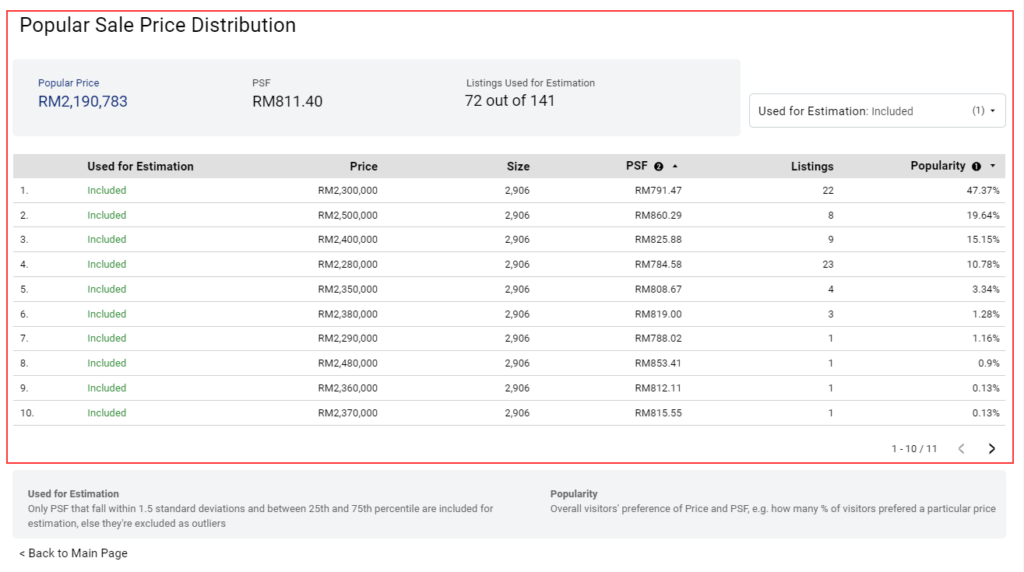
To dive deeper into the breakdown of the analytics, you can click on "View Popularity Distribution".
We hope this step-by-step guide is useful to help you harness the full potential of Popular Price Analytics!
For general enquiries, please reach out to our Customer Service at the following:
-
Phone: +603 7932 7555 (Mon - Fri 9am - 6pm, closed on PH)
- For technical assistance, please message us via WhatsApp at +60 12 697 5023
Mon - Fri 9am - 9pm, closed on PH (no phone call, message only) and we will get back to you within 1 working day.


