In addition to Popular Price Analytics, we have introduced Transaction Insights Lite which aims to empower Agent Partners with updated insights on property sales trends so you can:
Uncover Opportunities by evaluating buyer behaviour through sales transactions details.
Improve Negotiations by comparing and tracking past 3 years' transacted prices, size, and specs.
Identify Trends by analysing market performance through transaction amount and value.
Here’s a step-by-step guide to use Transaction Insights Lite:
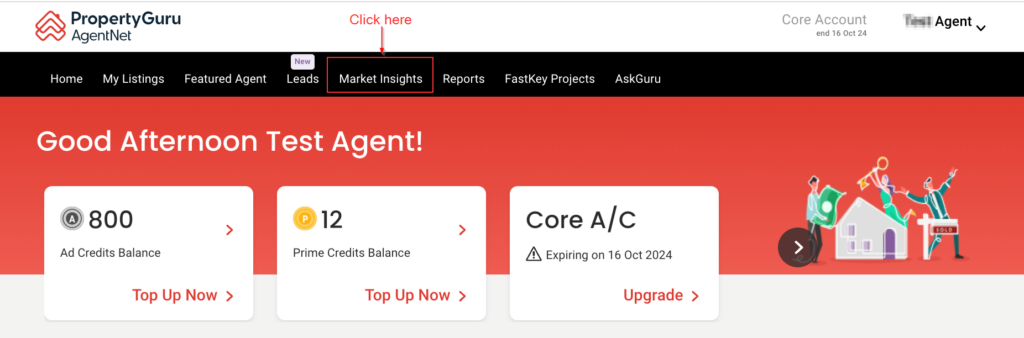
1. Login to AgentNet and click on the Market Insights tab. A new tab will open to land you on our propertyguruforbusiness (pg4business) platform.
First-time Login
If this is your first-time logging onto the pg4business platform,
you will be required to confirm your account first. You will not need to log in again after that. The system will log you in automatically.
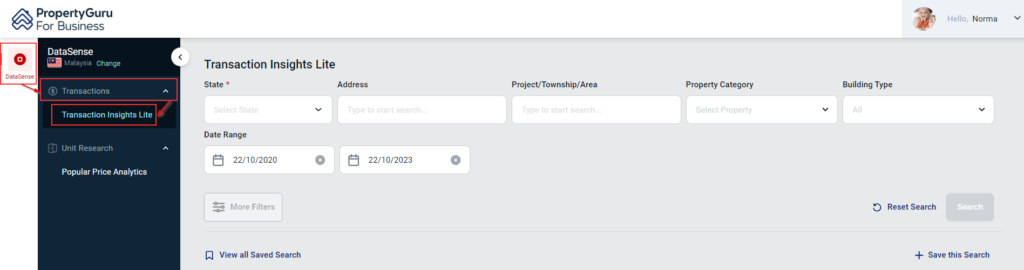
2. Once logged in to the pg4business platform tab, you can access Transaction Insights Lite under the 'Transactions' category.
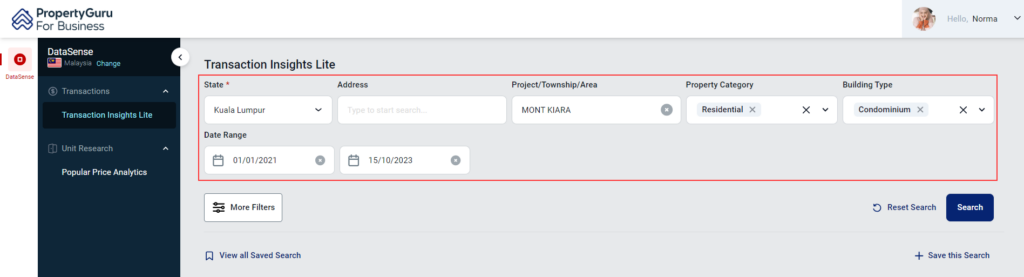
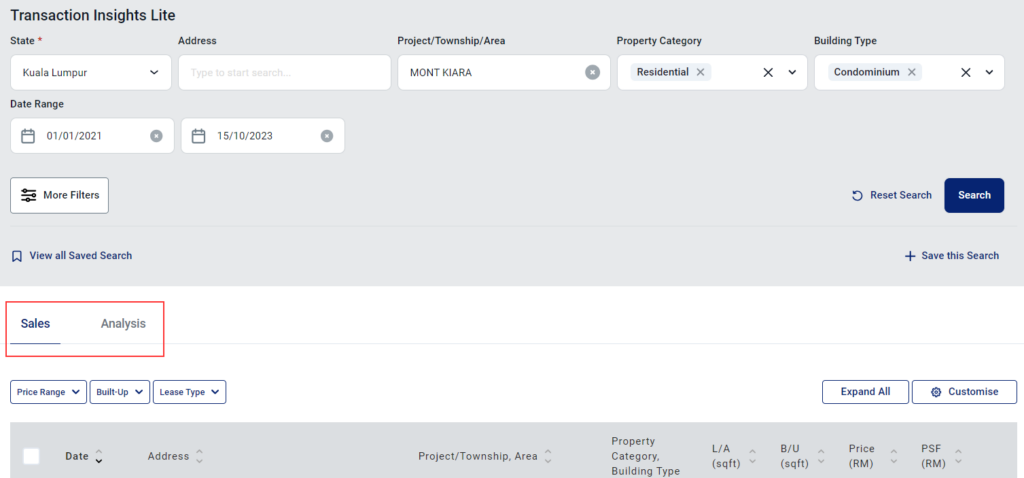
3. To begin a search, select a State, then complete the rest of the search criteria:
Address (for specific property search)
Project/Township/Area
Property Category (choose one or multiple e.g., Residential and Commercial)
Building Type (choose one or multiple e.g., Condo and Apartment)
Date Range (Note: Your current access is limited to 3 years of data)
Tip: Only the 'State' eld is required for a search to return results. Do this if you are interested to view trends for the whole state.
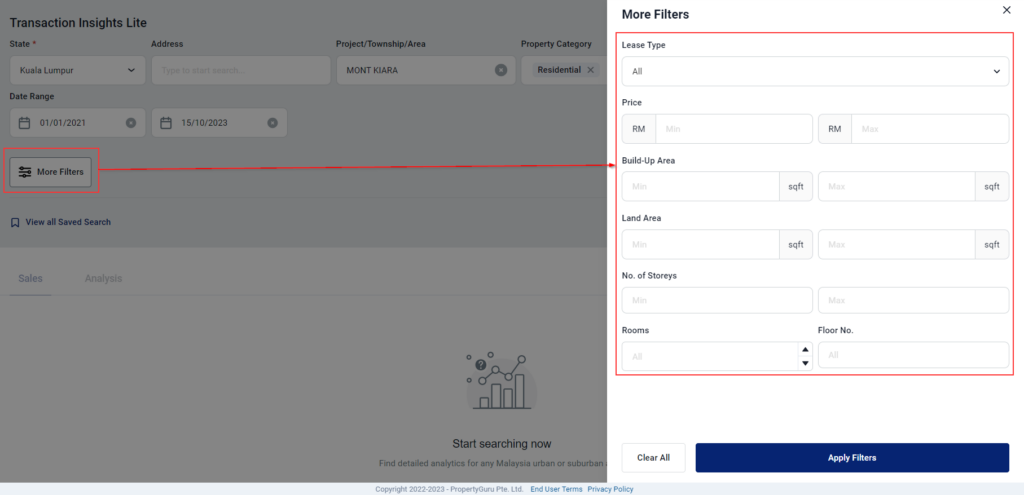
For a more detailed search click 'More Filters'. You will find more criteria available:
Lease Type
Price Range
Build-Up Area
Land Area
No. of Storeys Rooms
Floor No.
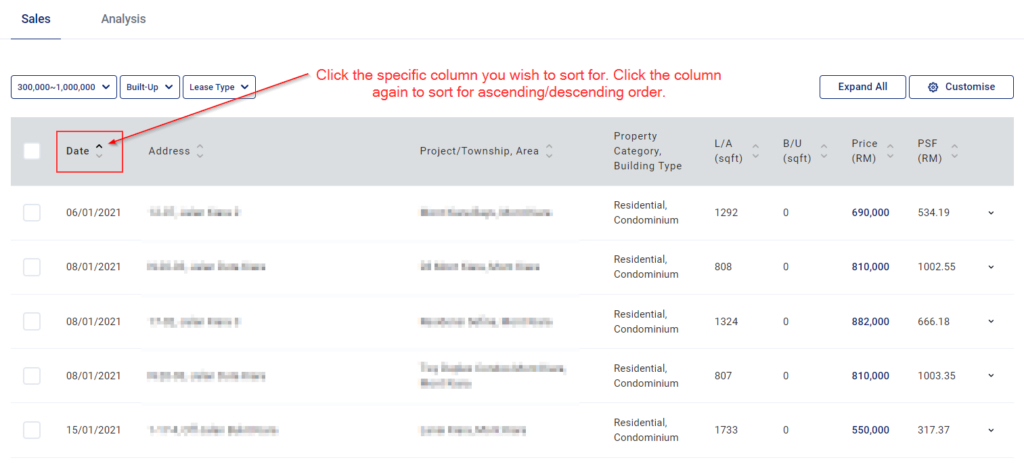
4. Your search result will show two tabs, 'Sales' and 'Analysis'. By default, the first search result will land on the 'Sales' tab.
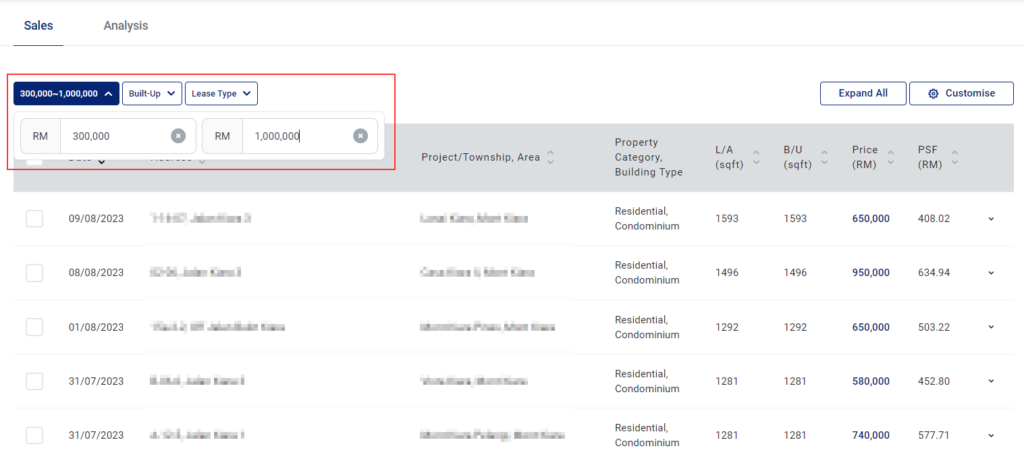
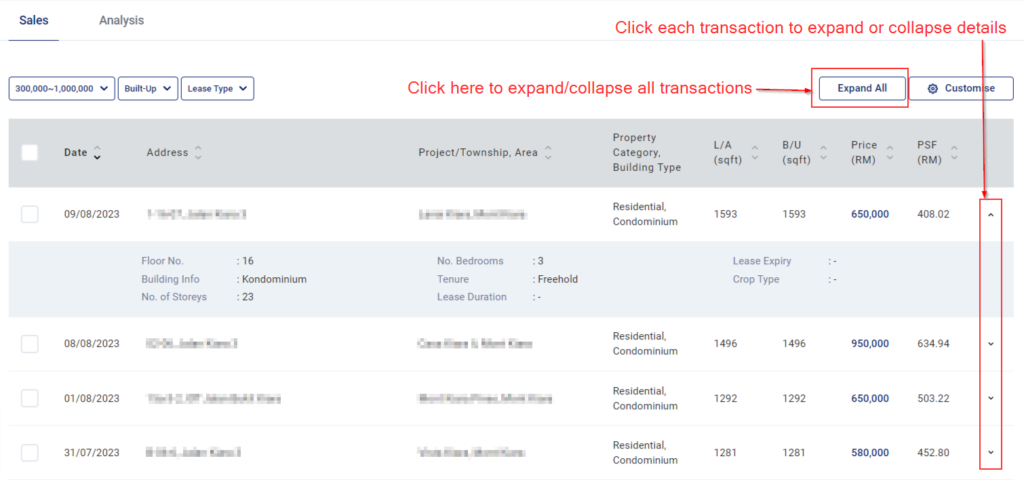
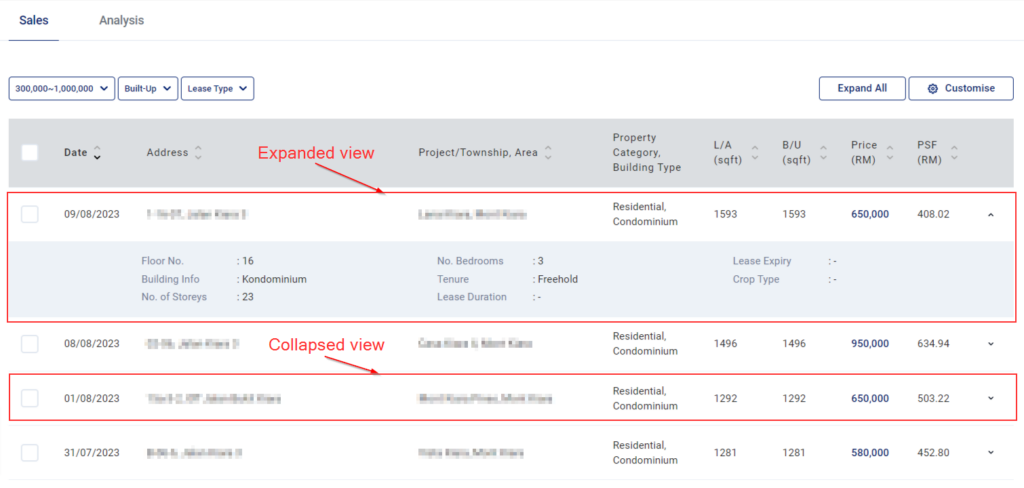
5. Under 'Sales' users will be able to view a list of property sales transactions. This list can be:
filtered (apply quick filters)
expanded/collapsed for details
sorted by column
'
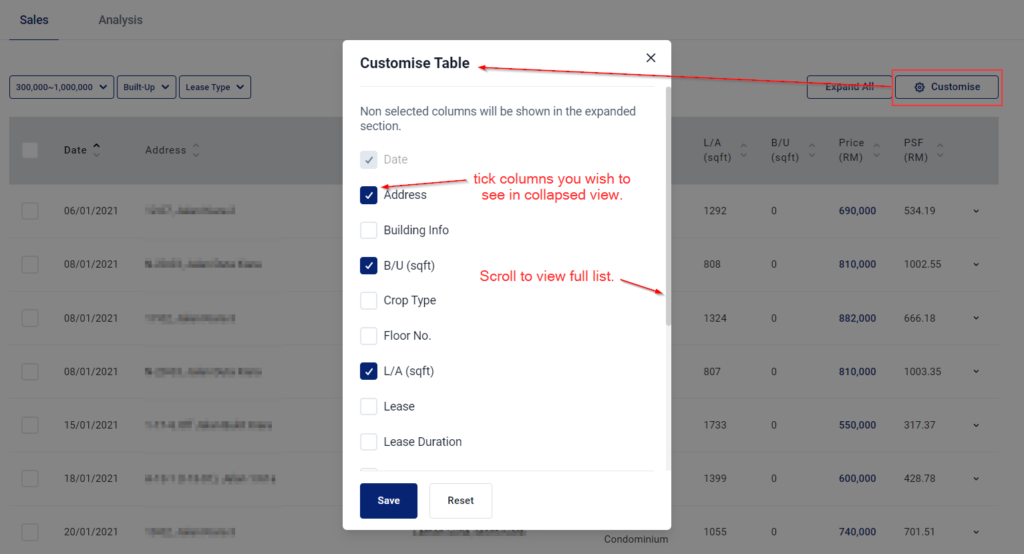
customised by column
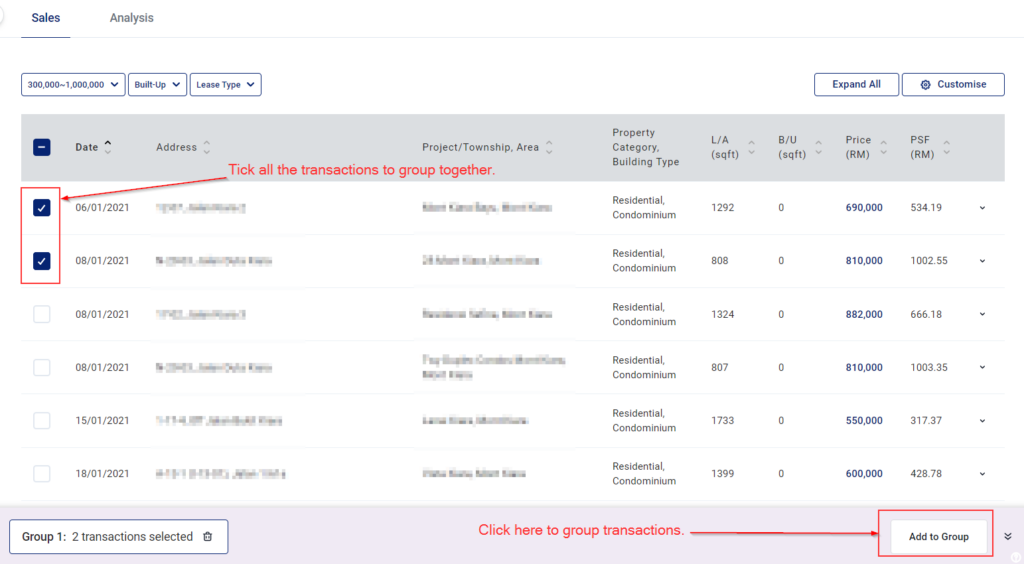
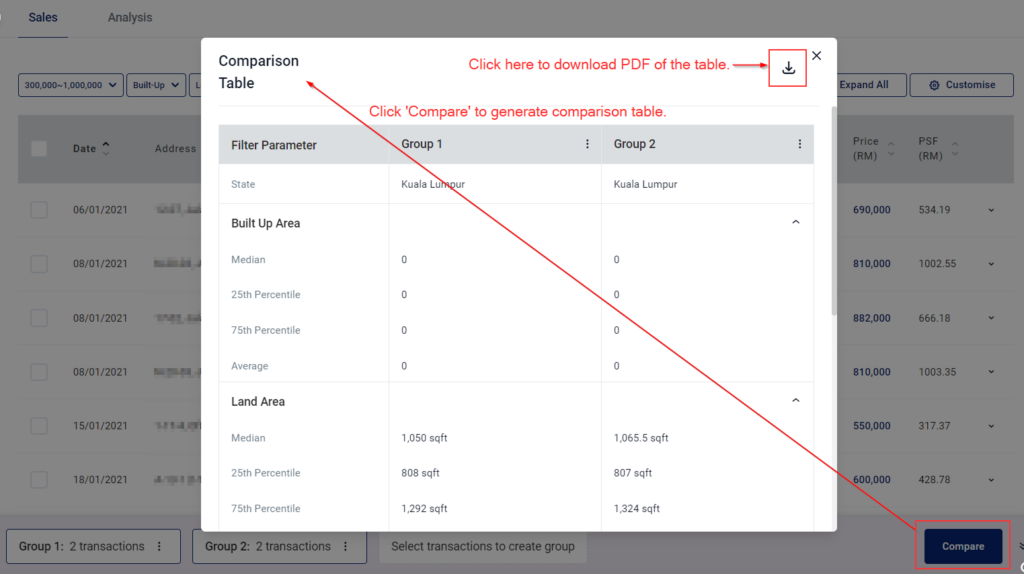
grouped by up to four groups for comparison
Note: a minimum of 2 groups is required for a comparison. Maximum of 4 groups is allowed.
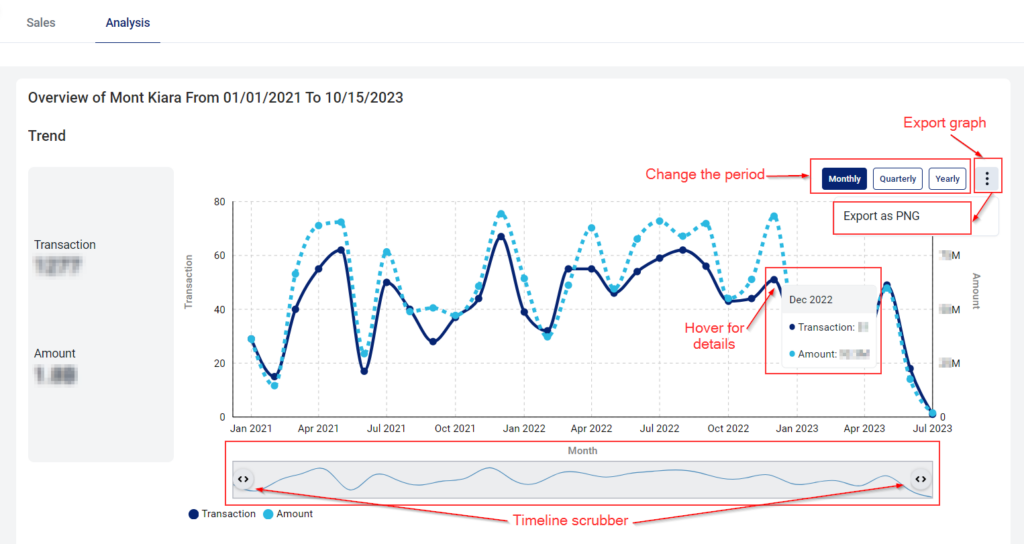
6. Under 'Analysis' users will be able to view 3 graphs:
Transaction Volume and Transaction Amount Trend
Median Price Trend
Median PSF Trend
Hover over the graph line for details.
You may change the timeline scrubber for more detailed view of the graph.
You may also view by 'Yearly', 'Quarterly', or 'Monthly'. These trend graphs are downloadable.
Note: The trend lines under Analysis tab only reect results entered for main search criteria (State, Address, Project/Township/Area, Property Category, Building Type, and Date Range). It does NOT include additional lters entered such as price range. The additional lters will only apply for Sales tab.
We hope this step-by-step guide is useful to help you harness the full potential of Transaction Insights Lite!
For general enquiries, please reach out to our Customer Service at the following:
 '
'